Strikes Were Up Significantly Last Year
New numbers show that the number of strikes and the number of workers on strike both went up last year. Labor is still incredibly weak, but more workers walking off the job is a very good thing.
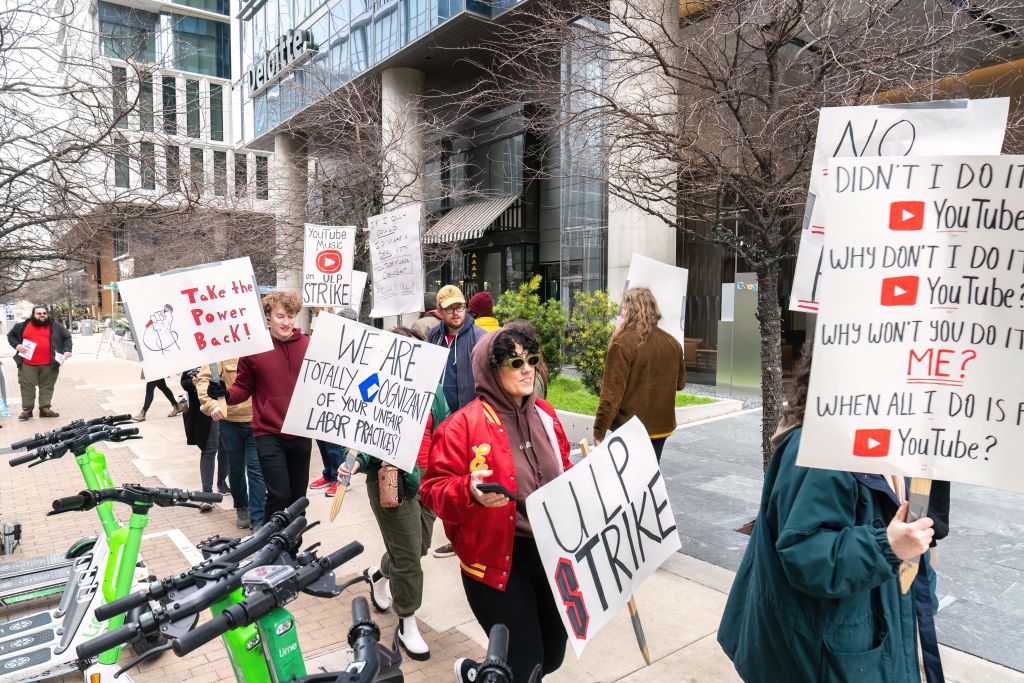
Subcontracted YouTube Music workers employed by Alphabet outsourcing partner Cognizant strike outside Google’s office in Austin, Texas, on February 3, 2023. (Photo by Suzanne Cordeiro / AFP via Getty Images)
The 2022 numbers are in: last year saw a 52 percent increase in the number of work stoppages from the previous year, with 60 percent more workers participating in such stoppages. The exact numbers: 272 work stoppages in 2021 grew to 424 in 2022; that number consists of 417 strikes and seven lockouts. While around 140,000 workers took part in a work stoppage in 2021, 224,000 workers did the same last year.
These numbers come from Cornell University’s School of Industrial and Labor Relations (ILR) Labor Tracker annual report. The ILR Labor Tracker has the advantage of including work stoppages by fewer than one thousand workers; thanks to funding cuts during the Reagan administration, the Bureau of Labor Statistics (BLS) only tracks major strikes of one thousand or more workers.
A 52 percent increase over 2021 is worth noting, but it should be contextualized within broader trends in US strike activity. Labor lawyer and author Tom Geoghegan wrote in 1991: “A few years ago, when labor was dying, that was interesting. But now it’s dead, and it has been dead.” When a number is small, it can increase by 52 percent but still remain very small indeed. Such is the case when one takes the longer view of work stoppages in the United States.
Union researcher Eric Dirnbach offers a few charts illustrating the longer-term trends in strike activity, among other data points, in his own roundup of last year’s data:
The 1950s had an average of 352 large work stoppages per year involving 1.6 million workers. Incredibly, the entire time period from the 1950s–1970s had over 300 large work stoppages per year on average (nearly one per day!) involving over 1.4 million workers annually. However, the 2010s only had an average of about 15 per year involving 150,000 workers. The huge drop in the 1980s happened in the era of the failed PATCO [Professional Air Traffic Controllers Organization] strike, leading to the term “PATCO Syndrome,” describing unions’ fear of striking and losing.
That broader view is not meant to dampen enthusiasm or dismiss the importance of workers’ activity but to bring a sense of perspective when analyzing the trends. Despite the uptick in strike activity, BLS numbers show that union density continued to fall, from 10.3 percent in 2021 to 10.1 percent in 2022. In other words, a significantly greater number of unionized workplaces saw strikes, but nonunion workers are struggling to overcome the myriad obstacles to unionizing even as nearly half of all workers say that they want to be in a union.
Nonunion workplaces comprise a significant proportion of the work stoppages that took place last year. The ILR report finds that 31 percent of the 424 work stoppages were by nonunion workers (though, it’s worth noting, those strikes were small, comprising only 3 percent of the 224,000 workers who struck last year).
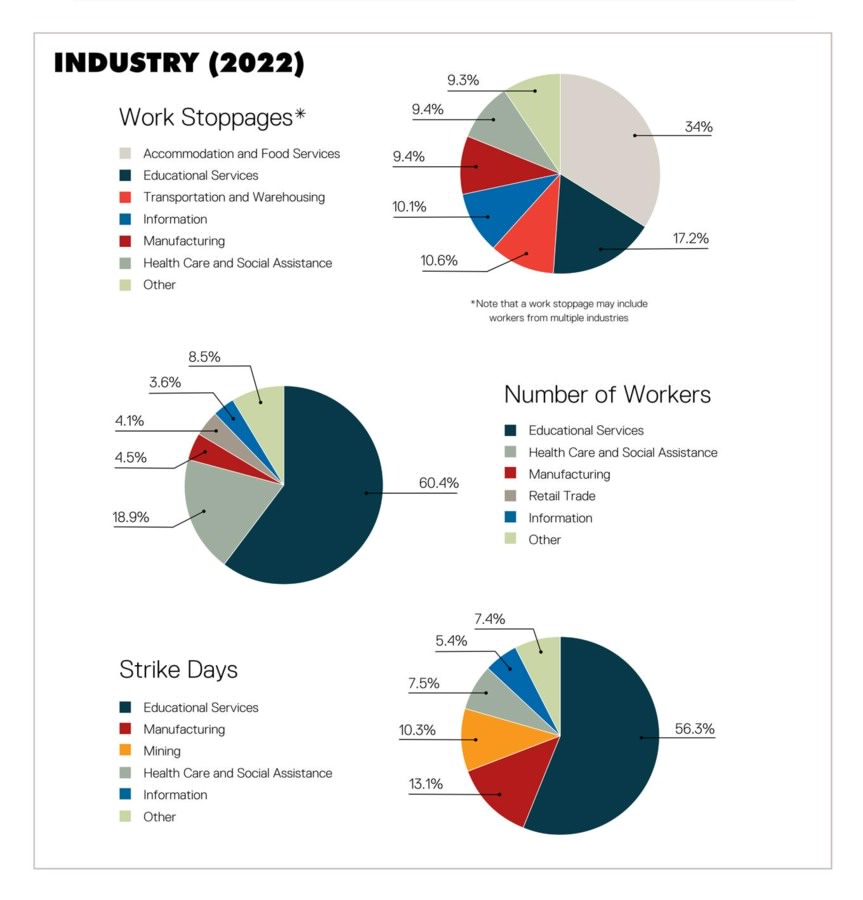
As for where these work stoppages are taking place, 80 percent of workers who went on strike in 2022 were in either health care (60 percent) or education (20 percent). These sectors comprise less than 20 percent of the US labor force, meaning these sectors’ workers are far more strike-prone than any others. There is a story to tell here: these are comparatively well-unionized sectors, meaning these workers are largely striking over new contracts rather than for a union or a first contract. As one can see by the fact that 97 percent of the workers who struck in 2022 were unionized, it is far easier to strike if workers already have a union.
Reflecting one of 2022’s biggest labor movement stories, the spread of the Starbucks Workers United union campaign, the overwhelming majority of strikes in the accommodation and food services sector were by Starbucks workers or fast-food workers in the Fight for $15 campaign (131 or 91 percent of the sector’s total number of work stoppages).
A few final data points worth noting: most workers were involved in work stoppages that lasted between five and nine days, while the overwhelming majority of strike days were from strikes that lasted over a month; of the 224,000 workers involved in work stoppages, the vast majority were in stoppages involving more than a thousand people.
One last thing driven home by the 2022 numbers: the looming strike by nearly 350,000 Teamsters at UPS, which will begin as soon as their current contract expires on July 31 of this year unless the workers have a tentative agreement, would be significantly larger than all of last year’s work stoppages combined.