Deregulation, Not Data Centers, Broke the Grid

Electricity bills are rising, and data centers are getting the blame. But for 50 years, the American grid absorbed loads this large while real prices fell. The difference between then and now? Deregulated markets.
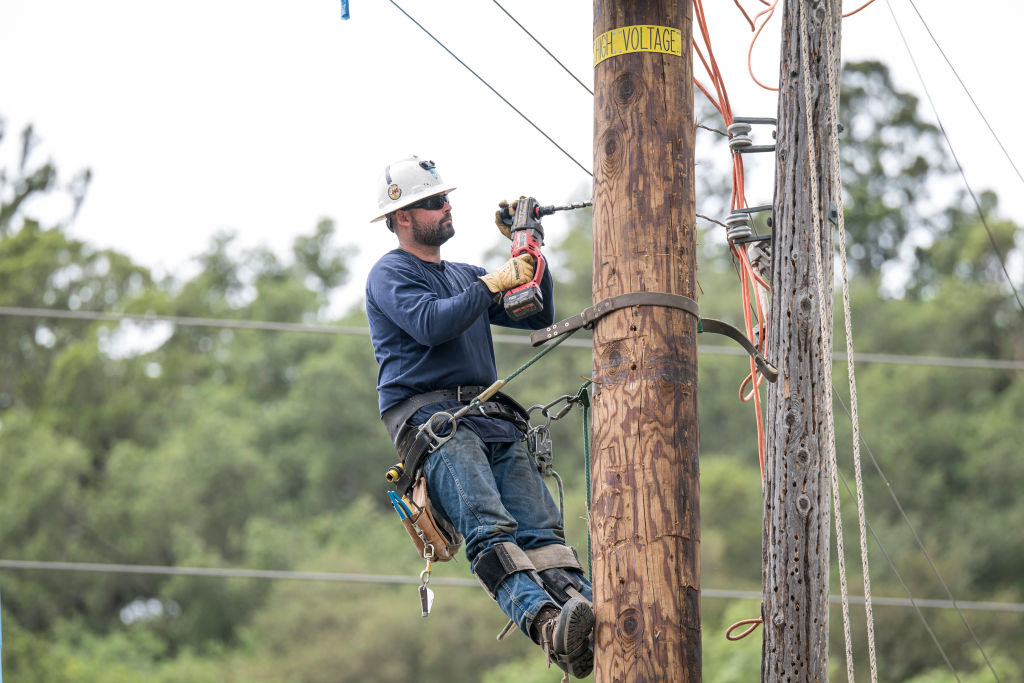
A PG&E worker drills a hole into a power pole in Yountville, California,  on April 29, 2020.

Data centers show how deregulated electricity markets risk pitting growth against affordability. Decarbonizing will require decades of load growth — which the grid once absorbed as real prices fell. Regulated power delivered both before and can again. (David Paul Morris / Bloomberg)


The public attribution of blame for rising electricity costs is half right. Data centers are indeed driving the first sustained surge in American electricity demand in more than a generation. But the historical record shows that electricity demand — what the industry calls “load” — has grown this quickly before without pushing prices up. What is different this time is not the load itself but the fact that it is landing on deregulated electricity markets that were never built to absorb growth.

Today, about a third of US retail electricity sales are in deregulated markets; the rest are served by traditional regulated utilities. That institutional variation — the same load growth running through two different market structures at the same time — is why economists can compare the bills.

A Century of Growth With Falling Prices

From an electricity perspective, aluminum smelters were the world’s first data centers. Aluminum is sometimes called “solid electricity” because of how electricity-intensive it is to produce: the metal is extracted from alumina through an electrolytic process. More than two hundred primary smelters operate worldwide today, drawing about 4 percent of global electricity — more than double the roughly 1.5 percent that data centers consume.

The United States led world production for most of the twentieth century. By 1943, sixteen American smelters accounted for 43 percent of global output while drawing about 8 percent of national electricity generation. That works out to a full 0.5 percent of national electricity generation for each individual smelter, on average. In relative terms, no data center operating today matches that share.

The following author-compiled figures show how the traditional relationship between electricity prices and generation growth broke down in the age of deregulation, or “restructuring,” as the industry calls it. Figure 1 tracks the real, inflation-adjusted electricity consumer price index for the United States and, as a comparator, Canada, over more than a century. Both lines fall for roughly fifty years — through a depression, a world war, and the most concentrated period of electrification either country has seen — ending up around two-thirds below where they started. That decades-long decline ended in the early to mid-1970s amid the era’s energy crises and the broader economic turmoil that accompanied them.

Inflation-adjusted electricity consumer price indexes for the United States and Canada, 1922–2026
Author’s calculations. US: Bureau of Labor Statistics, CPI-U series for electricity and all items. Canada: Dominion Bureau of Statistics/Statistics Canada, CPI for electricity and all items. Electricity-price indexes were divided by the corresponding all-items CPI and rebased to 1922 = 100.

Figure 2 shows how much electricity generation grew over that same period. Starting from 1922, US consumption first doubled by 1936, a fourteen-year span that included the Great Depression. It then doubled again in just seven years, by 1943, followed by successive doublings in ten years (1953), nine years (1962), and ten years (1972). The pace then slowed sharply, with the next doubling taking twenty-four years, arriving in 1996. Load stayed essentially flat from the early 2000s until growth resumed in 2022. Five doublings in fifty years is a far larger shock than anything the AI build-out is projected to deliver — and they occurred while prices were falling.

Electricity generation indexes in the United States and Canada, 1922–2026
Author’s calculations. US: Historical Statistics of the United States and U.S. Energy Information Administration. Canada: Historical Statistics of Canada and Statistics Canada. Annual generation was indexed to 1922 = 1.0.

Figure 3 plots the relationship directly, comparing the annual percentage change in US generation and in real prices over the past century. From 1922 to 1973, generation grew by an average of 7.7 percent a year while real prices fell by an average of 1.7 percent. From 1974 to 2025, growth slowed to an average of 1.7 percent a year and the real price decline nearly vanished, averaging just 0.2 percent. For most of the century the two lines are a rough mirror image. Steady, predictable, substantial generation growth went together with falling real electricity prices, and when the growth disappeared, so did the price declines.

Percentage change in US electricity consumer price index and generation
Author’s calculations: Bureau of Labor Statistics, CPI-U series for electricity and all items. US: Historical Statistics of the United States and U.S. Energy Information Administration for power generation. Both series smoothed using LOESS (FRAC=0.09; IT=3).

What Deregulation Broke

That mirror image was a product of institutional structure based on a political-economic compromise. Vertically integrated utilities — combining generation, transmission, and distribution within a monopoly franchise area — captured the economies of scale that came with growth. Economic regulation required that some of the efficiency gains be shared with consumers in the form of lower prices. A large new industrial load was therefore an opportunity: it increased generation utilization and spread fixed costs across more sales, pushing down average regulated prices.

Restructuring, which began in the US electricity sector in the late 1990s, severed that link. The old integrated utility model was broken up in states that deregulated. Generating electricity became a separate business, open to competition, while transmission and distribution remained regulated. Competitive wholesale power prices were then set through auctions that price power at the margin. New load appears to shift the demand curve upward in generation markets, raising wholesale energy prices, which were then mostly passed on to consumers through higher retail prices.

Figure 4 zooms in on the period from 1999 to 2025 and shows how quickly the century-old relationship came apart. By 2007, prices and generation were moving together rather than in opposite directions, and since 2020 both have risen in tandem. That is the signature of a system in which new load pushes prices up.

Percentage change in US real electricity consumer price index and generation, 1999–2025
Author’s calculations: Bureau of Labor Statistics, CPI-U series for electricity and all items. US: Historical Statistics of the United States and U.S. Energy Information Administration for power generation. Both series smoothed using LOESS (FRAC=0.09; IT=3).

This is not only a pattern in the aggregate data. A June 2026 study identifies a causal effect, and — this is the part that matters — it is not universal. Data center entry raised average retail electricity prices by a statistically significant 6.1 percent among privately owned utilities in deregulated states, compared with no statistically significant increase among publicly owned utilities in regulated regions. A March 2026 study found the same mechanism at the wholesale level, with data centers raising competitive wholesale prices in deregulated supply-constrained regions while having negligible effects elsewhere. The same load, arriving in two different market structures, produces two different bills.

It is worth being precise about what the country traded away, because aluminum gave the grid more than a load to grow into. US aluminum production peaked in 1980, with thirty-three smelters producing about 30 percent of world output, drawing about 8.87 gigawatts and employing roughly 26,000 production workers — about three workers per megawatt of load in a workforce with deep union density. After 1980, the smelter count fell: to twenty-three by 1990, to nine by 2014, and to just six by 2024, two of them idled. In 2017, the New York Times documented the punch line: American companies now smelt aluminum in Iceland. By 2025, the United States was producing less primary aluminum than Iceland, a country of fewer than four hundred thousand people. China now produces 60 percent of world output, much of it from dozens of mega-smelters, while Canada, America’s main supplier, produced about 4.6 percent of global output from its nine primary smelters.

From the roughly 30 percent global share it held in 1980, the United States now accounts for only about 1 percent of primary aluminum production. The United States has been a net importer of primary aluminum every year since 1992, and Canada has long been its largest foreign supplier, even as Canadian production held roughly steady while the American industry kept shrinking. The current administration’s response has been protection rather than rebuilding, dressed up as a national security necessity: Section 232 tariffs, imposed on aluminum at 10 percent in 2018, lifted for Canada in 2019, reimposed at 25 percent in March 2025, and doubled to 50 percent that June. Aluminum is covered under the Canada–United States–Mexico Agreement (CUSMA), and Canada has challenged the tariffs through World Trade Organization dispute consultations and CUSMA procedures. There is something more than a little ironic about treating import dependence as a security threat after decades of domestic policy choices hollowed out the industry.

Deregulation Was Never a Growth Strategy

Maybe data centers can fill some of the gap by replacing some of the electricity demand once represented by aluminum smelting. They accounted for about 4.4 percent of US demand in 2023, and forecasts project that figure roughly doubling up to 9 percent by 2030 as the AI build-out accelerates. That would put data centers in the same range as aluminum smelting’s wartime peak of about 8 percent of national generation.

In employment and union terms, however, the comparison is not close. Like other types of physical infrastructure, data centers generate construction work, but those jobs are temporary. Once operating, large data centers typically employ about 0.3 to 0.5 permanent workers per megawatt of capacity, roughly one-tenth to one-sixth of what smelting supported, and the operational workforce appears almost entirely nonunion. Data centers can approximate aluminum’s electrical footprint, but not remotely its labor or union footprint. The country is being asked to absorb the load of a heavy industry while getting almost none of the jobs.

Which brings us back to the structure that has to absorb the load. Restructuring was never a growth strategy, and its architects never claimed it was. US electricity consumption was essentially flat for nearly two decades, as efficiency gains and the shift away from manufacturing offset population and economic growth. It was in that flat demand environment, not an expansionary one, that restructuring was designed. Reformers in the 1990s argued that regulated utilities were saddled with high-cost legacy investments, that new gas-fired plants had become small and efficient enough to compete, and that unbundling generation from transmission would let competition, rather than a monopoly utility’s capital plan, decide what got built. It was a market built to allocate a flat or shrinking pie among competing bidders, not to expand a system rapidly enough to serve rising demand.

This matters well beyond data centers. Decarbonization means electrifying transportation, heating, and industry — decades of sustained load growth of exactly the kind the American grid once absorbed while prices fell. Deregulated markets risk turning that into a choice between growth and affordability. Regulated utilities did not: both the econometrics and a century of price data show that they were better able to adapt to growth without levying price penalties on consumers. Ending the deregulation experiment is not nostalgia. Regulated power has delivered both growth and affordability before — and can do so again. The aluminum smelters are not coming back. But the institutions that built the grid around them should.