Bernie Is Right: 60% of Americans Live Paycheck to Paycheck

Bernie Sanders says it over and over again: 60% of Americans live paycheck to paycheck. Centrist critics swear this is false. Once we sort through the noise, we see Bernie is right on the money.

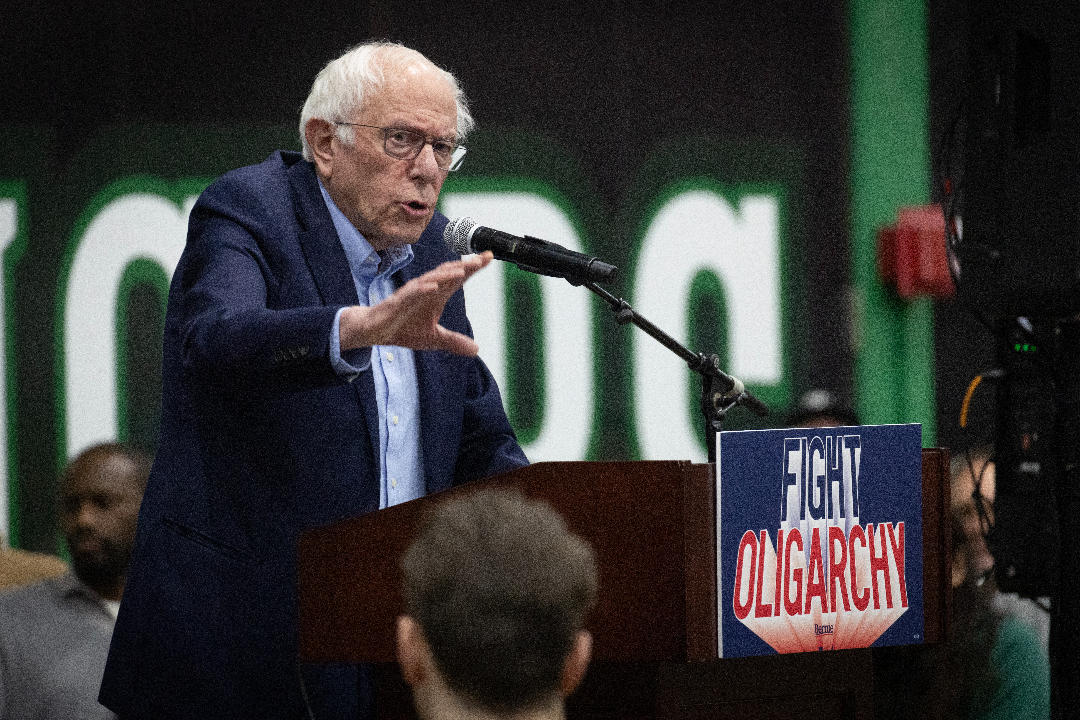
Bernie Sanders speaks to a capacity crowd during an event at University of Wisconsin–Parkside on March 7, 2025, in Kenosha, Wisconsin. (Scott Olson / Getty Images)

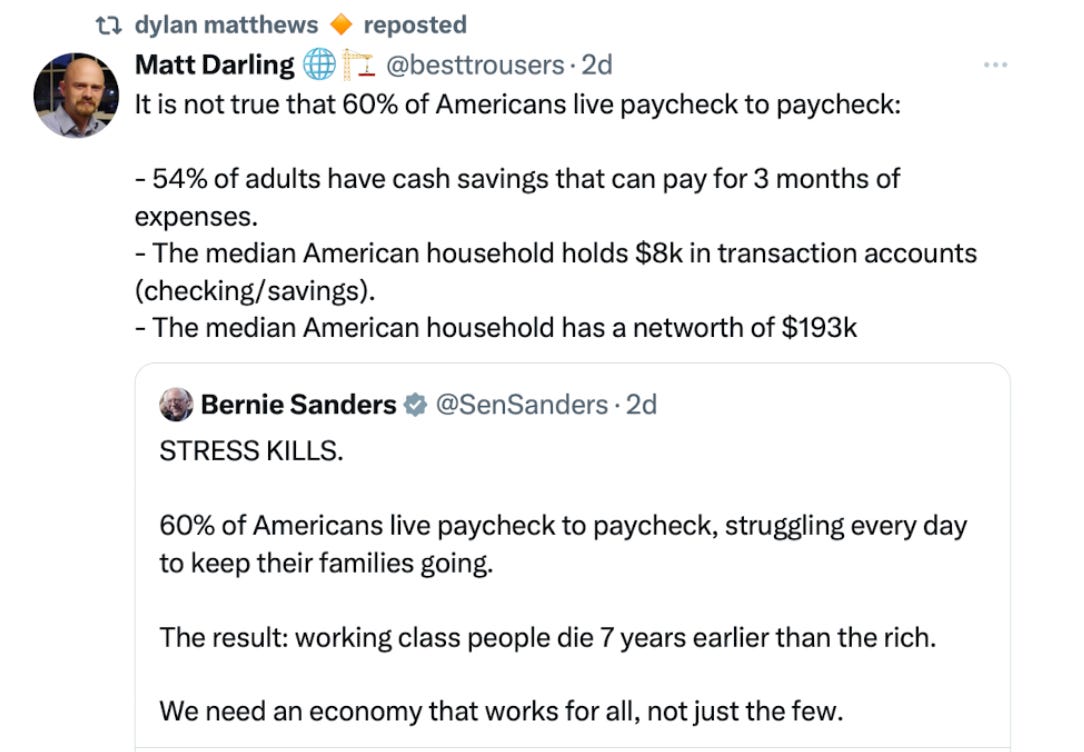
Bernie Sanders says it over and over again: 60% of Americans live paycheck to paycheck. But Matt Darling of the Niskanen Center swears it’s not true and Dylan Matthews of Vox calls it a damned lie. Even Matt Yglesias is apparently on the case, but I’m blocked from seeing his posts.

Who’s right and who’s wrong? Who should we listen to? Bernie Sanders — a model citizen of our community? Or the infamous Vox-Niskanen syndicate?

The answer is that Bernie is right. In the 2019 Survey of Consumer Finances (SCF), conducted triennially by the Federal Reserve, the median working-age (25–64) household, excluding active business owners, reported its “normal income” as $73,175 per annum, and had $4,521 in transaction balances, such as checking or savings accounts. (All amounts are in 2022 dollars.)

That’s about 3.2 weeks’ worth of income in cash. If “living paycheck to paycheck” means having less than a month’s worth of income saved in cash, then calculated in this way, the “60%” factoid gets it exactly right: the share of working-age, non-business-owning households living paycheck to paycheck was:

  • 63% in 1998
  • 63% in 2001
  • 64% in 2004
  • 64% in 2007
  • 67% in 2010
  • 64% in 2013
  • 61% in 2016
  • 59% in 2019

In other words, Bernie nailed it.

What led the above-cited pundits to the erroneous conclusion that it was Bernie who erred?

The most important factor, quantitatively speaking, is slightly technical and takes a bit of explanation. If you want to use household wealth data to determine what share of Americans “live paycheck to paycheck,” you have to exclude business owners from the analysis. This isn’t just because — to state what should be obvious — business owners can’t “live paycheck to paycheck,” no matter how poor they are, since they don’t receive a paycheck.

The more important point is that including business owners in the data distorts the analysis quantitatively. Business-owning households typically report extraordinarily large holdings of cash assets — far out of line with their incomes or net worth. And while there’s no way to prove this with certainty, it’s pretty clear the reason is that a significant proportion of the cash balances they report as household wealth is actually, in functional terms, working capital for their businesses.

Although the SCF tries to strictly measure household finances and asks respondents to exclude any accounts “used solely for business purposes,” in practice it’s extremely common for business owners to mingle business and personal accounts. (Almost half have been found to use personal credit cards for business expenses, for example.) More fundamentally, money is fungible: as long as the same person controls both the business and the household accounts, it’s impossible to determine how much of those funds should be considered “household savings” and how much “working capital,” short of reading the account holder’s mind.

Failing to exclude working capital when assessing household financial security isn’t a debatable methodological choice; it’s just plain wrong — an accounting mistake, akin to confusing revenue and profit on an income statement.

Here’s an illustration by way of analogy. A financially strapped teacher or office worker, facing a money emergency, could theoretically come up with the needed money by selling their car and start taking the bus to work — but an Uber driver facing the same problem couldn’t, because the car is how they make money. The teacher’s car thus constitutes a form of household wealth, which can potentially be “dipped into.” The Uber driver’s car doesn’t. If you include business owners and their un-disentangleable working capital in your household wealth calculations, you’re counting billions of dollars of cash assets that serve the same function as the Uber driver’s car, as if they were a rainy day fund available to be tapped by households.

And when you do exclude business owners from the calculations, the ramifications are huge. The median business-owning household has liquid assets equivalent to eight weeks’ worth of income, versus barely more than three weeks for non-business owners. The disparity is especially wide for households with moderate incomes: the median business-owning household with income under $60,000 has more liquid assets in absolute terms ($6,144) than the median non-business-owning household ($5,216) with income over $60,000 but below $120,000.

Another factor that led the pundits astray was the famous “excess savings” bubble of the COVID-19 era. Matt Darling uses data from the 2022 edition of the SCF to claim that “the median American household holds $8k in transaction accounts (checking/savings).” That’s an understandable move, since 2022 is the survey’s most recent wave. But 2022 was also near the peak of the savings boom, which was the product of a temporary goods shortage conjoined with temporary cash injections from the federal government.

In 2022, SCF respondents reported liquid balances that were unprecedentedly high: the share of working-age households with less than one month’s income in cash (again, excluding business owners) plummeted from 59% in 2019 to an all-time low of 52% in 2022. Subsequently, however, all those “excess savings” were spent down, as the San Francisco Fed noted last year in a report titled “Pandemic Savings Are Gone: What’s Next for US Consumers?” — which included the following chart:

While we won’t have fresh data from the SCF until 2026, it’s pretty clear that if the survey were fielded today, the ratios would look a lot less like the 2022 numbers cited by Darling, and a lot more like those of 2019.

Putting it all together — excluding business owners, focusing on working-age households (the ones who rely on paychecks), and ignoring the temporary COVID-related circumstances of 2022 — it turns out (as shown above) that year after year, in survey after survey of the SCF, close to 60% of households report holding less than one month’s income in cash reserves.

There’s one more data point to quibble with before moving on to bigger things: iI Bernie is right that 60% of Americans live paycheck to paycheck, what should we make of the survey Darling cites in which 54% of households say they have three months’ income saved for emergencies?

Darling’s source is the Fed’s Survey of Household Economics and Decisionmaking (SHED). Unlike the SCF, which is an exhaustive, all-day, in-person affair where respondents are literally asked to provide the names of every financial institution they do business with and list every financial account they hold, the SHED is a breezy twenty-minute online survey that asks questions about everything from cryptocurrency to natural disasters.

The specific question at issue reads: “Have you set aside emergency or rainy day funds that would cover your expenses for 3 months in case of sickness, job loss, economic downturn, or other emergencies?” Here’s the problem. Exactly the same question, with identical wording, was asked by a different survey the previous year (the Financial Industry Regulatory Authority’s 2022 National Financial Capability Study) and got almost exactly the same result (53% of respondents saying yes) — and yet in that very same survey, when respondents were subsequently asked, “How confident are you that you could come up with $2,000 if an unexpected need arose within the next month?” only 43% answered “I am certain I could come up with $2,000.”

How is that possible? If 53% of respondents have a rainy day fund covering three months’ worth of expenses, how could only 43% of them be certain they could come up with $2,000? It’s not mathematically possible.

The problem with the SHED question, I suspect, stems from its wording. “Have you set aside emergency or rainy day funds . . . ?” is a framing that seems almost calculated to inject social desirability bias into the responses. When abruptly asked to confess their personal finance sins to an anonymous survey bot, many people evidently demur. Internal psychological housekeeping is probably more at work in this case than any accurate accounting of personal finances.

Liquidity Matters

Now it could be argued — and not without reason — that any attempt to quantify the phenomenon of “living paycheck to paycheck” must inevitably be arbitrary. Why restrict our focus to checking and savings accounts when households have other resources they can draw on in a financial emergency?

If you don’t have liquid savings, you can take cash out of retirement accounts. If you don’t have retirement accounts, you can run up a credit card. If you’ve maxed out your credit card, you can borrow from friends or family, use a payday lender, or pawn your belongings. If you own a home, you could sell your house and move into a rental. If you already rent, you could move out and sleep in your car. Or you could liquidate a portion of your human capital by selling your plasma or organs.

But for the people facing these choices, the options aren’t equal and interchangeable. Being forced to sell savings bonds to meet an unexpected financial shock is not the same as being forced to sell your house (let alone a kidney). To wave away the difference on the grounds that, either way it’s just “selling a household asset” to meet a given expense, is not only clueless — it’s a denial of economics.

There’s a reason financial commentators refer to market turmoil as a “flight to liquidity.” Liquidity means safety. And safety is a luxury good: only the rich can afford it. That’s why Bernie says “paycheck to paycheck” over and over again: because it resonates. Not as much as “permitting reform,” maybe, but still it resonates.

Some pundits are now digging in their heels and denying that 60% of Americans live paycheck to paycheck. But some of them also seem to be saying that, even if the number is true, it doesn’t evidence any real hardship. Isn’t it financially imprudent to keep too much of your savings in cash anyway? Maybe three weeks’ worth of cash is plenty.

For them, I have a sincere question. Why is it that the rich, who have a choice, never choose collectively to keep less than a month’s worth of their income in cash — even though a month’s worth of income, in their case, is a lot of money? Nowadays the top 10% of income earners, on median, consistently hold more than two months’ worth of their incomes in cash — more than three times the proportion of the bottom 90%. Why?

To be clear, the question isn’t why the rich have so much more money or wealth (that’s not a mystery). Nor is it even why they have so much wealth in proportion to their incomes. It’s why they choose to keep nine weeks’ worth of their (very large) incomes in cash, when they could be indulging in the purported pleasures of proletarian illiquidity?

I think the answer is obvious. Bernie is right: liquidity is intensely desirable — but very expensive to maintain. Most Americans are too poor to afford it.