The Lives of Seven Children Tell the Story of UK Inequality
The lives of seven children, each representing a different income bracket, reveal the stark realities of inequality in contemporary Britain. Even the best off of the seven is disadvantaged in the country with Europe’s fastest-rising child poverty rates.
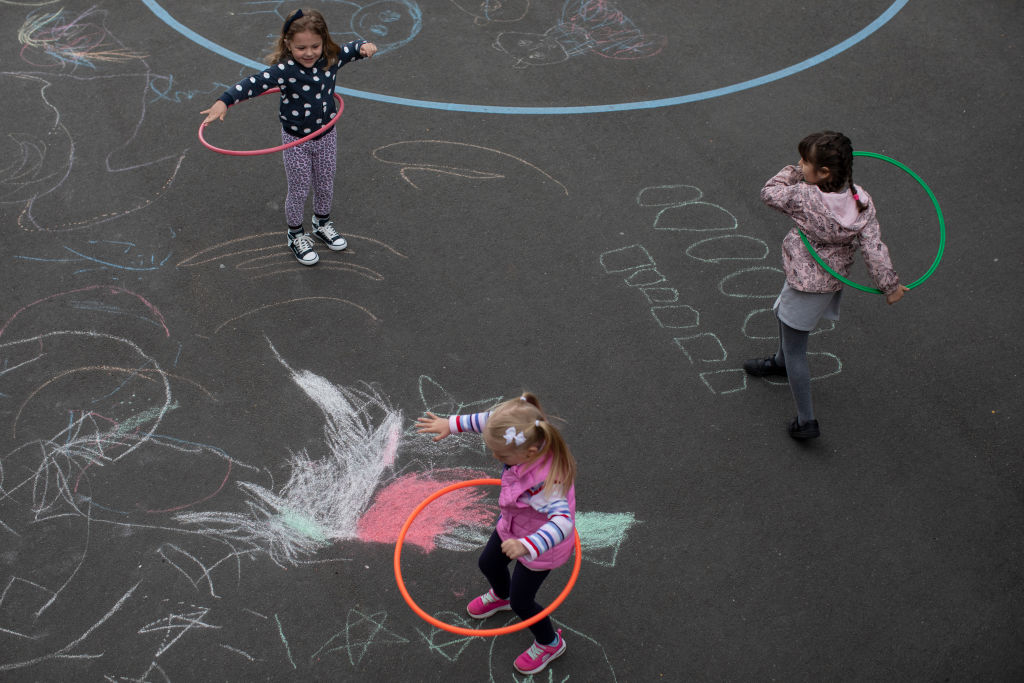
Children hula-hoop on a playground in London, England, on June 4, 2020. (Dan Kitwood / Getty Images)
One way to try to understand the health and priorities of a state is to look at how its children are treated. In the fall of 2018, there were about fourteen million children in the UK. If you divide those fourteen million into seven groups, ranging from the poorest to the richest families, and select the middle child from each group of two million, you have seven representative children by income. By chance, these seven children might also reflect the distribution of other aspects of life in the UK — through their ethnicity, for example, the range of geographical areas they have grown up in, or whether they live with one parent or two (or very occasionally none).
Few British families with young children have much wealth, making income the best measure to differentiate their circumstances. In the UK, income largely determines children’s life chances. Seven is the minimum needed to represent the range.
Why choose 2018? Because it was a year of peak income inequality, a year before the pandemic, when social statistics were still reliably collected. Comparing these numbers with recent post-pandemic data, we can get an idea of current social and economic trends. In the fall of 2024, each child will have their sixth birthday. The graph below shows how much money their families have to live on each year after they have paid their taxes and paid the rent or mortgage.