We Really Need to Eat the Rich
Here's a statistic to get your class rage going: since 1989, the top 1 percent's net worth has skyrocketed by $21 trillion. And the bottom 50 percent's? It's plummeted by $900 billion.
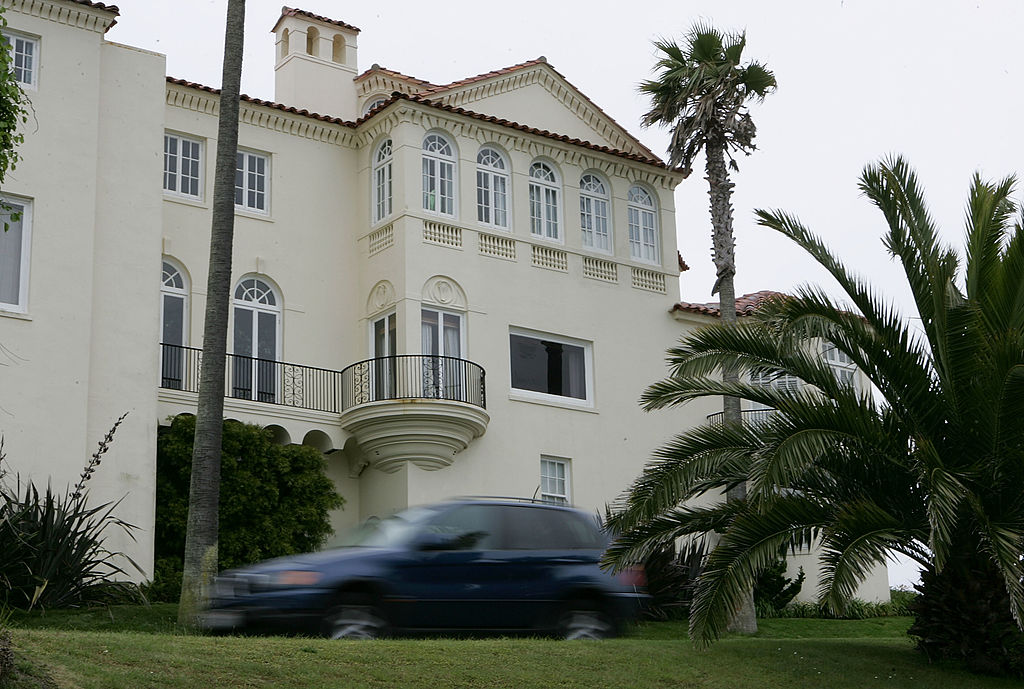
A car drives by a luxury home on May 26, 2005 in the Sea Cliff neighborhood of San Francisco, CA. Justin Sullivan / Getty
Every quarter, the Federal Reserve puts out the Financial Accounts (aka “Z1” or “Flow of Funds”), which provide economy-wide aggregates for nearly every kind of asset and liability there is. Every three years, they put out the Survey of Consumer Finances (SCF), which is a household survey that records many of the same kinds of assets and liabilities that are in the Financial Accounts. In a perfect world, the assets and liabilities in the SCF would sum up to the aggregates in the Financial Accounts, but for various reasons they do not.
Recently, the Federal Reserve released a new data series called the Distributive Financial Accounts, which combine the Financial Accounts and the SCF to provide quarterly estimates of the distribution of wealth in America that do sum to the aggregates in the Financial Accounts. The series goes back to 1989, the first year the modern SCF was administered and runs to the fourth quarter of 2018, the last quarter for which there is Financial Accounts data.
The insights of this new data series are many, but for this post I want to highlight a single eye-popping statistic. Between 1989 and 2018, the top 1 percent increased its total net worth by $21 trillion. The bottom 50 percent actually saw its net worth decrease by $900 billion over the same period.