Austerity Is Causing America to Rot

If it seems like nothing works anymore in the US, you’re not imagining things. Record-low public investment and declining private investment have given us a failing, decrepit infrastructure.

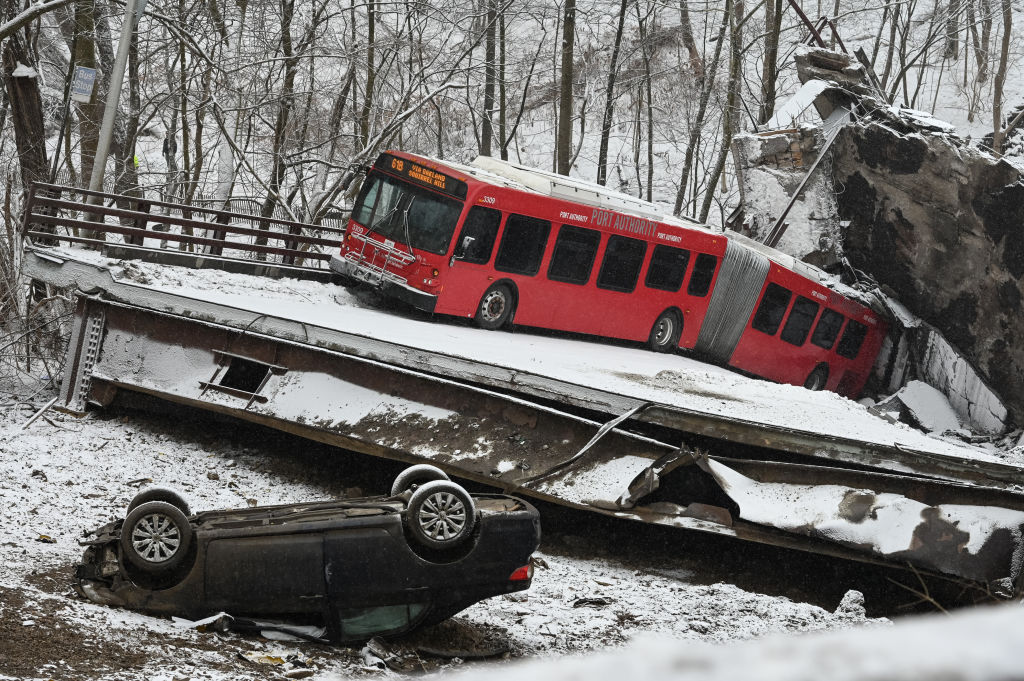
A major bridge in Pittsburgh collapsed just hours before President Joe Biden was scheduled to visit the city to tout his infrastructure bill, January 28, 2022. (Justin Merriman / Bloomberg via Getty Images)

It’s been a while since I looked at one of the major reasons for the pervasive sense of rot about the United States: the low level of investment — investment in real things, that is, not crypto. It’s barely keeping up with the forces of decay. If you’re wondering why nothing works and everything seems to be falling apart, here are some explanations.

First a definition: investment is spending by businesses, governments, and individuals on long-lived physical assets like buildings and machinery. Gross investment is the dollar value of such spending; net investment is what remains after deducting depreciation, aka wear and tear. That’s not an easy process to put a dollar value on, but it’s all we’ve got. And besides, these are numbers the capitalist state produces to understand its economy, so why not take them seriously, even if the bourgeoisie seems unalarmed about them?

Graphed below is the average value of net public and private investment as a percentage of GDP by decade. Civilian public investment means expenditures on long-lived assets like schools and roads but excludes the military. (To anticipate a question I sometimes get: yes, prisons are in there too, but they don’t count for much; almost all the costs of maintaining the carceral state come from day-to-day operations.) Private investment consists of purchases of buildings, equipment, and intellectual property (IP) by businesses. Not shown on this first graph: residential investment, the purchase of housing by individuals, and improvements to that housing.

Averages for the 1930s reflect the extraordinary circumstances of the Great Depression: private investment collapsed and New Deal–driven public investment soared. Those high levels of public investment gave us an infrastructure that we still use today — schools, post offices, and parks. (For a catalog of those projects, check out the Living New Deal.) Public investment sagged during the 1940s, reflecting World War II, but rose in the 1950s and 1960s, matching the 1930s level as the public sector expanded. It was not to last: austerity and privatization consciousness took over, and now net public investment is at a record low.

Private investment rose in the decades after World War II, peaking in the 1970s. But the Wall Street–driven imperatives of profit maximization that got the upper hand via the shareholder revolution of the 1980s, which transformed corporate practices, put the squeeze on investment. Investing too large a share of corporate profits in things came to be seen as wasteful — better instead to hand the cash over to the shareholders via stock buybacks and traditional dividends.

Here’s a yearly view of the trajectory of decline, a path traced by the dotted trendlines. The graphs begin in 1950, because the extremes of the 1930s and ’40s would have distorted the scale.

These graphs show a relative stability in net private investment from the late 1950s through the early 1980s, when Wall Street’s grip on corporate cash flow tightened. There was a surge in the late 1990s, the period of the “new economy” mania and the early commercial internet — an enthusiasm which was at least backed up with investment in the technology that was supposed to bring about the future. We haven’t seen much of that in the latest iteration of tech mania, the era of Uber and Airbnb.

Here’s a look at some components of private investment. The equipment and especially the structures trendlines show a persistent downward path. Against that, IP’s rise stands out — to the point where it’s surpassed investment in buildings and is rivaling equipment. Both equipment and structures used to be several times IP. Capitalists are spending less money on things that are supposed to promote general prosperity and more on legal arrangements that protect theirs.

Low levels of net private investment aren’t driven by declines in gross investment, which has been pretty stable. Instead, the major reasons for the decline are a shift toward shorter-lived equipment, and the immateriality of IP and a shift away from buildings. From 1950 to 1999, net fixed private investment averaged 32% of gross; since 2000, it’s averaged 20% — and 16% since 2020. Every asset category has seen that shift — even buildings.

Intellectual property investment, whose share of business investment grew from 8% in 1950 to 40% today, adds another layer of fleetingness to the story. Business ideologues love to tout IP as a stimulant to innovation; who’d invent anything if they couldn’t patent it? Lots of people would, actually. That aside, most basic innovation in sectors like computing and pharmaceuticals have been funded by public entities, not private companies, who then appropriate those innovations to make profits from research they didn’t pay for. Instead of supporting innovations, a lot of IP investment is about trying to establish monopolies, be it in the latest variation on an antidepressant or a Disney cartoon character. But even here, the trend toward shorter-lived assets is visible: net IP investment went from 27% of gross in the 1950s and ’60s to 16% since.

For the public sector, the decline in net investment has been more dramatic, falling from around 2% of GDP in the early decades on the graph to 0.4% since 2020. (It’s 0.3% so far in 2022.) Like the private sector, we’ve seen a shift toward shorter-lived assets, but unlike the private sector, we’ve also seen a decline in gross investment, which fell by almost half between the 1960s and 2020s. Net public investment as a percentage of gross went from 67% in the 1950s and 1960s to 27% in the 2020s. Net federal civilian investment is just 0.1% of GDP so far this decade, a third of its 1950–1999 average. State and local investment has fallen harder, down by almost three-quarters from that fifty-year average to 0.5% in the 2020s (0.3% so far this year).

And as the graph above shows, residential net investment isn’t doing too great either: it went from an average of 2.8% of GDP from 1950 to 1999 to 1.7% in the 2020s. Unlike the mid-2000s housing bubble, which took net residential investment up to 3.8%, the highest since the early post–World War II years, the latest bubble took net housing investment up to just 1.9% of GDP last year. It’s fallen back to 1.4% in 2022. That’s not the way to meet a housing deficit estimated by Freddie Mac at 3.8 million units.

The burst of net private investment in the late 1990s gave us a major productivity acceleration, but it was not to last. And the burst in civilian public investment from the early 1950s through the late 1960s gave us interstate highways, schools, and state university systems. The long declines in net investment, both private and public, have given us stagnant productivity growth and a collapsing infrastructure.

As I put it when I wrote about net investment five years ago, “If I were a debased purveyor of clickbait, I’d call this ‘Everything that’s wrong with America in two charts.’ But I’m not, so I won’t. But still . . .”

Truer than ever.