Quantifying Incarceration
The numbers on mass incarceration make one thing clear: it is a gigantic machine for entrenching inequality.
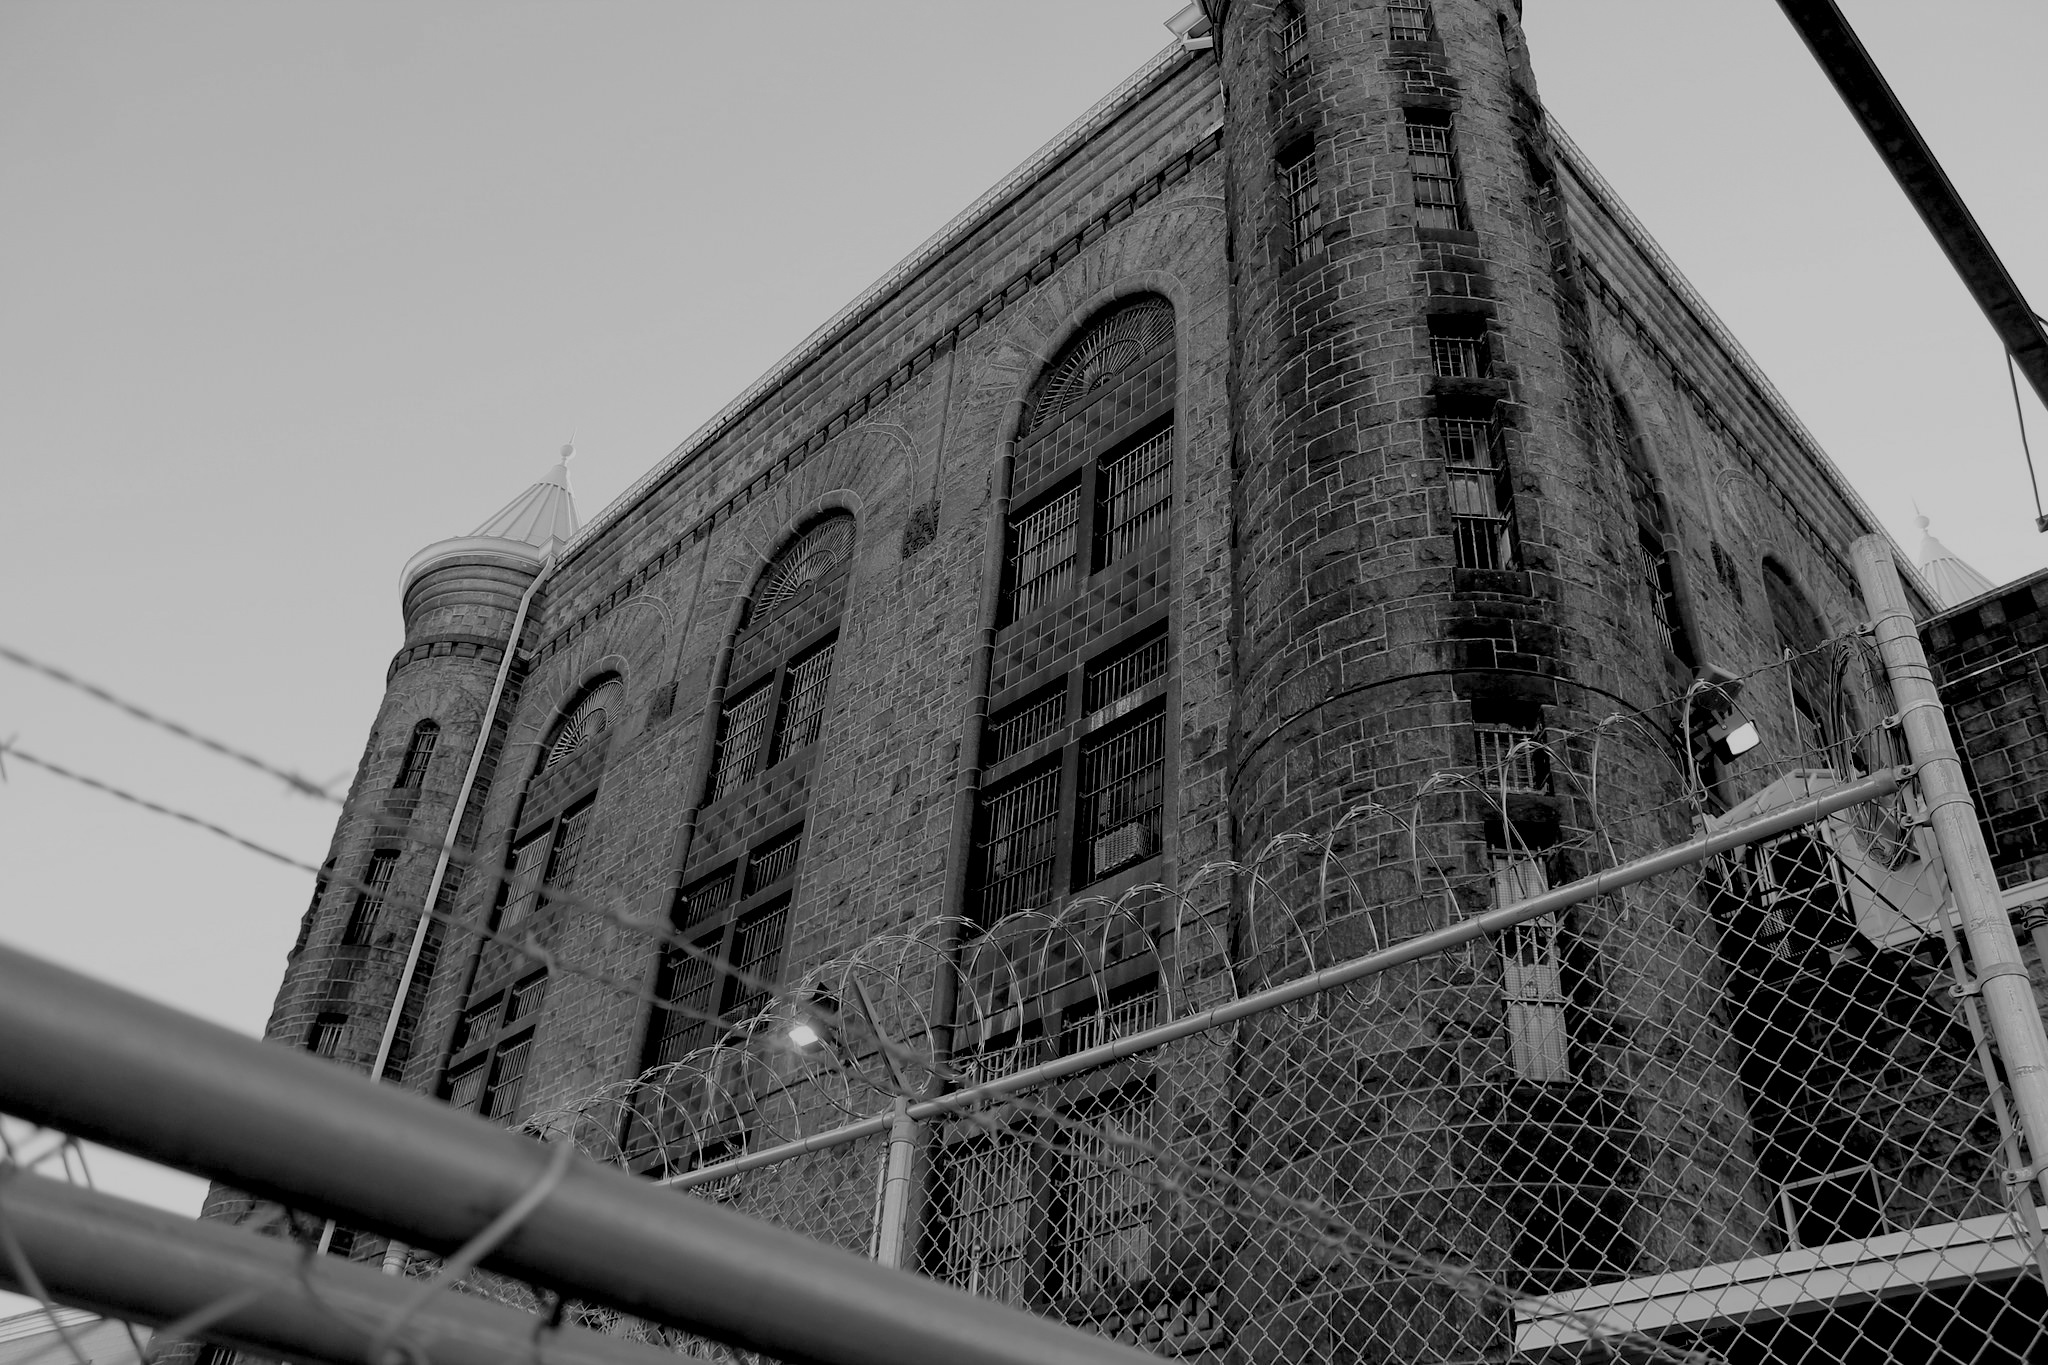
A jail in Baltimore, MD. Elvert Barnes / Flickr
In the 1970s America embarked on a ghastly experiment in mass incarceration. As part of a wider process of criminalization — driven by the “war on drugs,” local law enforcement policies, economic changes, and shifting racial politics — the United States began locking up people in droves. Living in any American community decades later, you can feel its disastrous effect all around you. But how big is mass incarceration’s footprint? How can it be quantified?
One index is the scale of the prison and jail population at any moment in time. It soared from around 400,000 in the mid 1970s to 2.3 million in 2010. That’s appalling, but it understates the impact of criminalization because it does not count those who have been convicted of felonies and not incarcerated. Furthermore, it counts only those currently detained, rather than the entire population of people, mainly men, who have been processed by the system and bear its stigma for the rest of their lives.
Calculating the size of those wider populations requires one to consult a broader array of data not only on the prison and jail populations, but also those on parole and those convicted of felonies as a whole. It also requires us to move from the flow of people processed by the system in any given period to the stock of those who have been affected by it over a period of decades.